How I Stand Up a Log, Trace and Metrics Stack for a New Project in One Command
On this page
- Introduction
- A. What the stack holds
- B. Why one stack per project, and why "shows" is part of done
- C. The shortcuts I rejected
- D. Six obstacles in the way
- Method
- A. Creating the data directory before Docker does
- B. Letting one node be healthy on a small disk
- C. Starting in the order the services need
- D. Zero replicas without losing the official mappings
- E. A collector that can only write its own data
- F. Data views before dashboards
- Results and Discussion
- A. What one command produces
- B. Running it without a person at the keyboard
- C. Where this stops
- Conclusion
- Terms
Introduction
Every project I run in production needs a place where its logs, traces, and metrics go, and a way to look at them when something goes wrong. I wanted that place to exist for a new project after one command: a stack that accepts telemetry as soon as it starts, and that already shows it in dashboards the first time I open them, without a single click in the user interface to set anything up.
A. What the stack holds
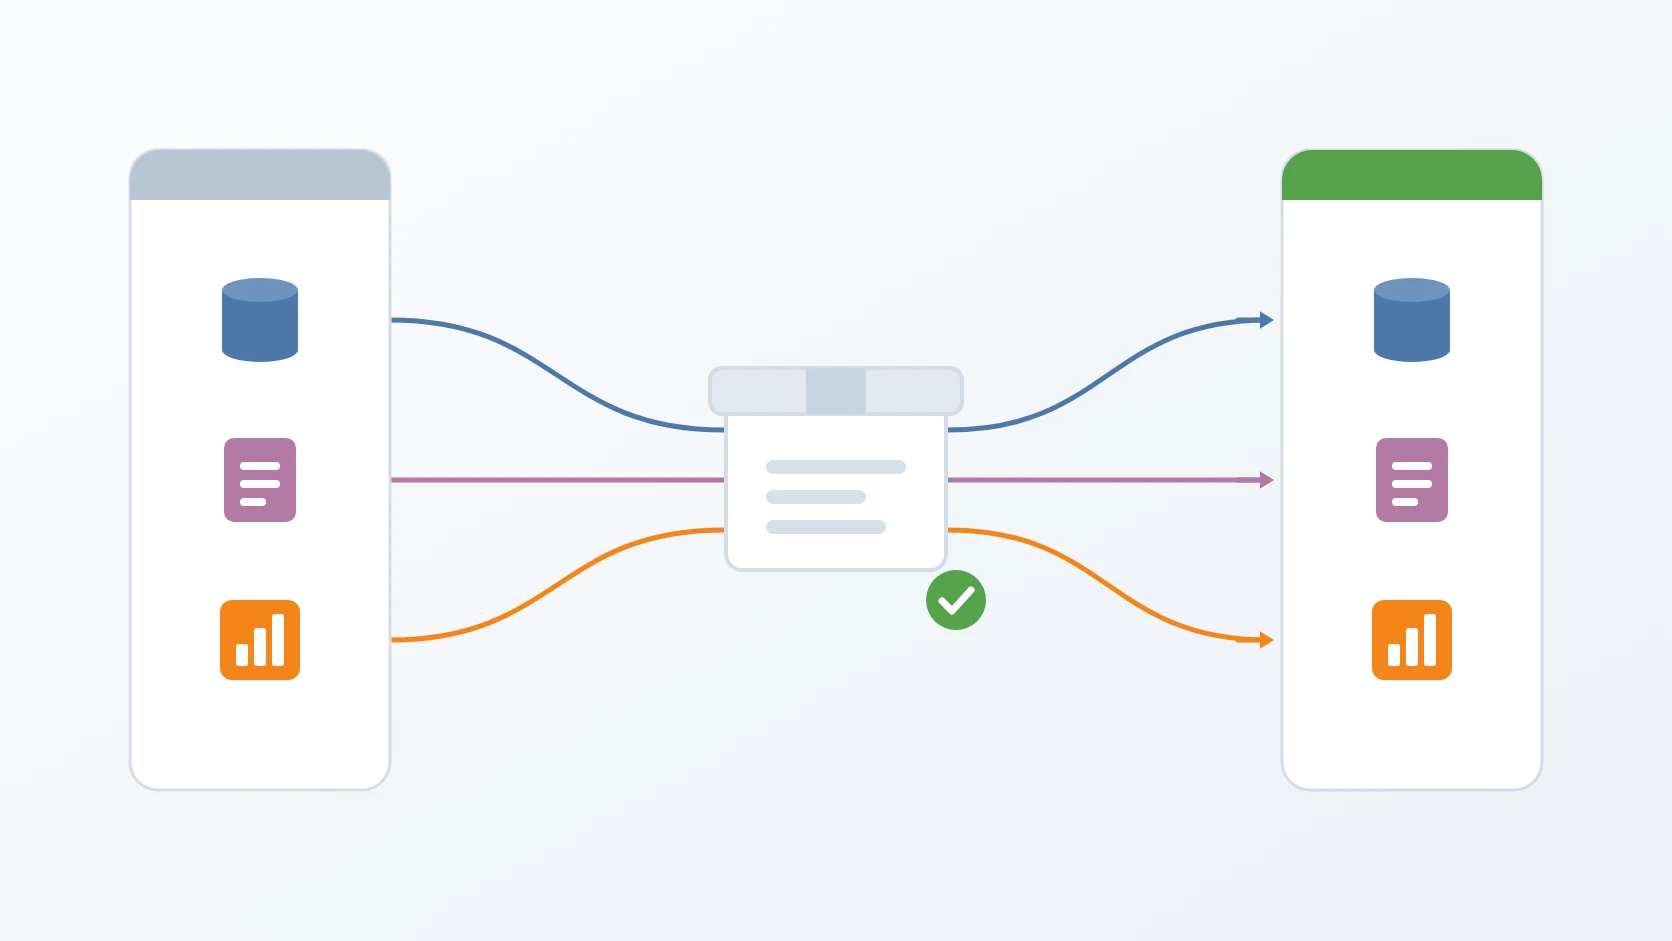
The stack has three parts. The OpenTelemetry Collector receives telemetry from every service of the project over OTLP, the standard protocol of the OpenTelemetry project, on one port for gRPC and one for HTTP. Elasticsearch stores what the collector forwards, as three families of data streams: one for logs, one for traces, and one for metrics. Kibana reads Elasticsearch and shows it, through data views that tell it which data streams to read and dashboards built on top of those data views.
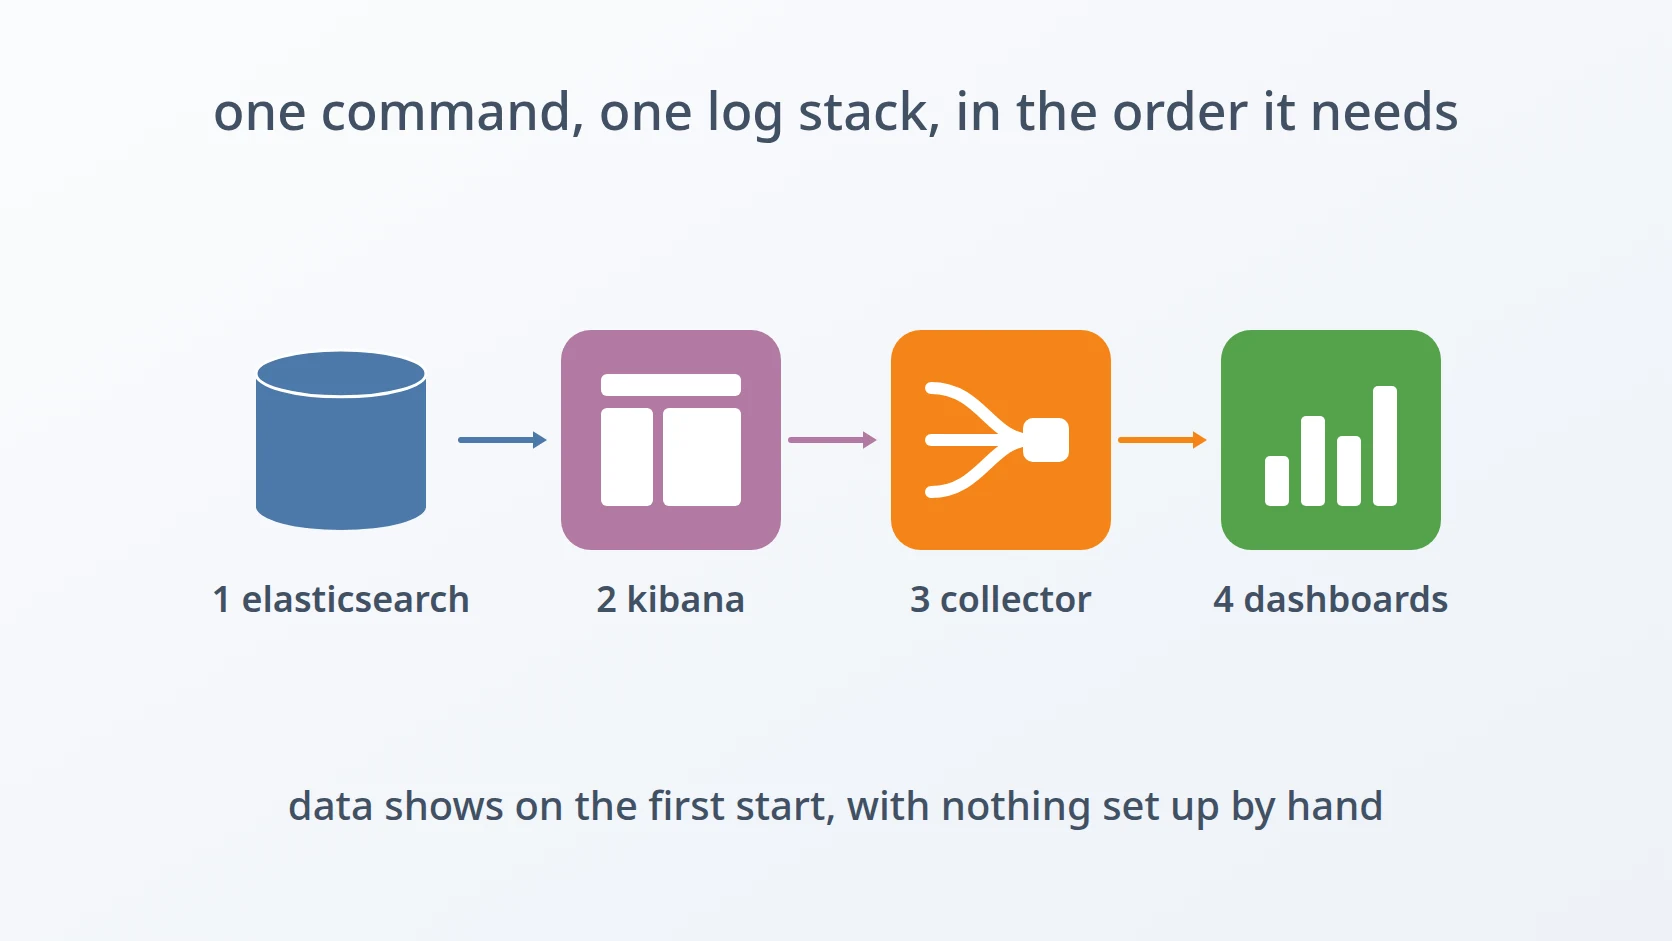
Each part depends on the others in a specific way. The collector cannot deliver anything until Elasticsearch accepts its writes, and it needs a user that is allowed to write. Kibana cannot start until it can log in to Elasticsearch with its own built-in account. And Elasticsearch, as it turns out, cannot accept the right settings for the collector's data until Kibana has started at least once. A stack where those dependencies are satisfied by hand works only as reliably as the hand that satisfied them.
B. Why one stack per project, and why "shows" is part of done
Each project gets its own stack rather than a shared one. Logs from one client's system never sit in the same database as another's, a project can be moved to another server with its telemetry, and a misbehaving project can fill its own disk without filling everyone else's. The cost of that separation is that the stack has to be created many times, which is exactly what makes a generator worth writing.
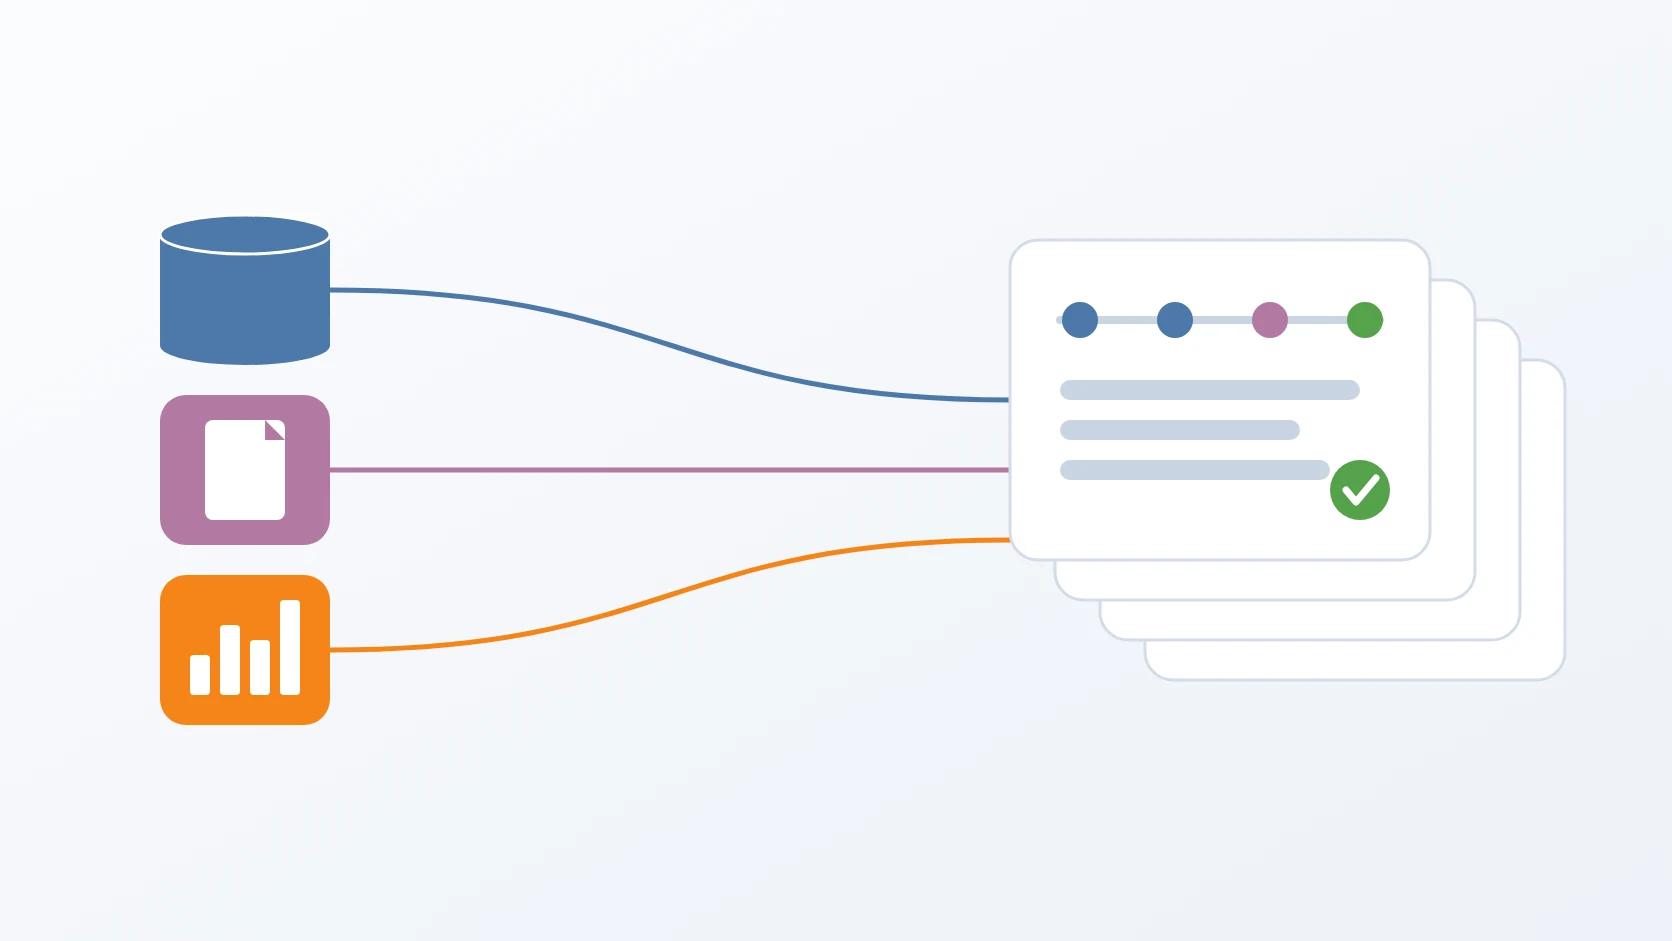
I also decided early that "the stack works" means more than "the containers are healthy". A collector that accepts data while Elasticsearch silently rejects it, or an Elasticsearch full of data that Kibana has no view for, both pass a health check and both leave me blind at the moment I need to see. The definition of done is that a trace sent by a service appears on a dashboard, and the generator has to reach that state without me.
That definition also changes how a failure is noticed. If the dashboards are only built when someone needs them, the first time anyone discovers that telemetry was never arriving is during an incident, which is the worst possible moment to start debugging the debugging tools. A stack that shows data from its first minute turns a missing dashboard into an obvious problem on the day the project is set up, while nothing depends on it yet.
C. The shortcuts I rejected
One shortcut is a single shared logging stack for all projects. It is cheaper to run, but it mixes clients' data, it makes every project's retention and disk usage everybody's problem, and it turns one stack's outage into an outage of visibility everywhere. I rejected it for the same reasons I keep the projects themselves apart.
The second shortcut is to start the containers and then set up the rest in Kibana's interface: create the data views, build the dashboards, add a user for the collector. It works once. It is also undocumented, slightly different every time, and impossible to repeat exactly on the next project. The third is to copy the folder of the last project's stack. That carries the previous project's names into the new one — in its roles, its users, its templates, its container names — and a log stack that writes under another project's name is worse than none, because it looks right.
What remained was a template where every project-specific name is a placeholder, and a generator that fills those placeholders, prepares the host, starts the containers in the order they need, and then performs every setup step through the APIs that the user interface would otherwise call.
D. Six obstacles in the way
Easy to state, awkward to build. Six things stood between a template and a stack that shows data on its first start.
The data directory is created by the wrong user. When a bind-mounted directory does not exist yet, Docker creates it, as root. Elasticsearch runs as an ordinary user inside its container, cannot write to a root-owned directory, and fails to start with an error about obtaining a node lock. Letting Docker create the directory is the rejected alternative; it fails every time, and only on a clean host.
A host with a tight disk keeps the cluster from ever becoming healthy. Elasticsearch stops placing data once its disk passes a watermark, so on a lab server with little free space a single node never reaches green or yellow, its health check never passes, and every step that waits for it waits forever. Keeping the default watermarks is the rejected alternative, because they exist to protect replicas on a multi-node cluster this stack does not have.
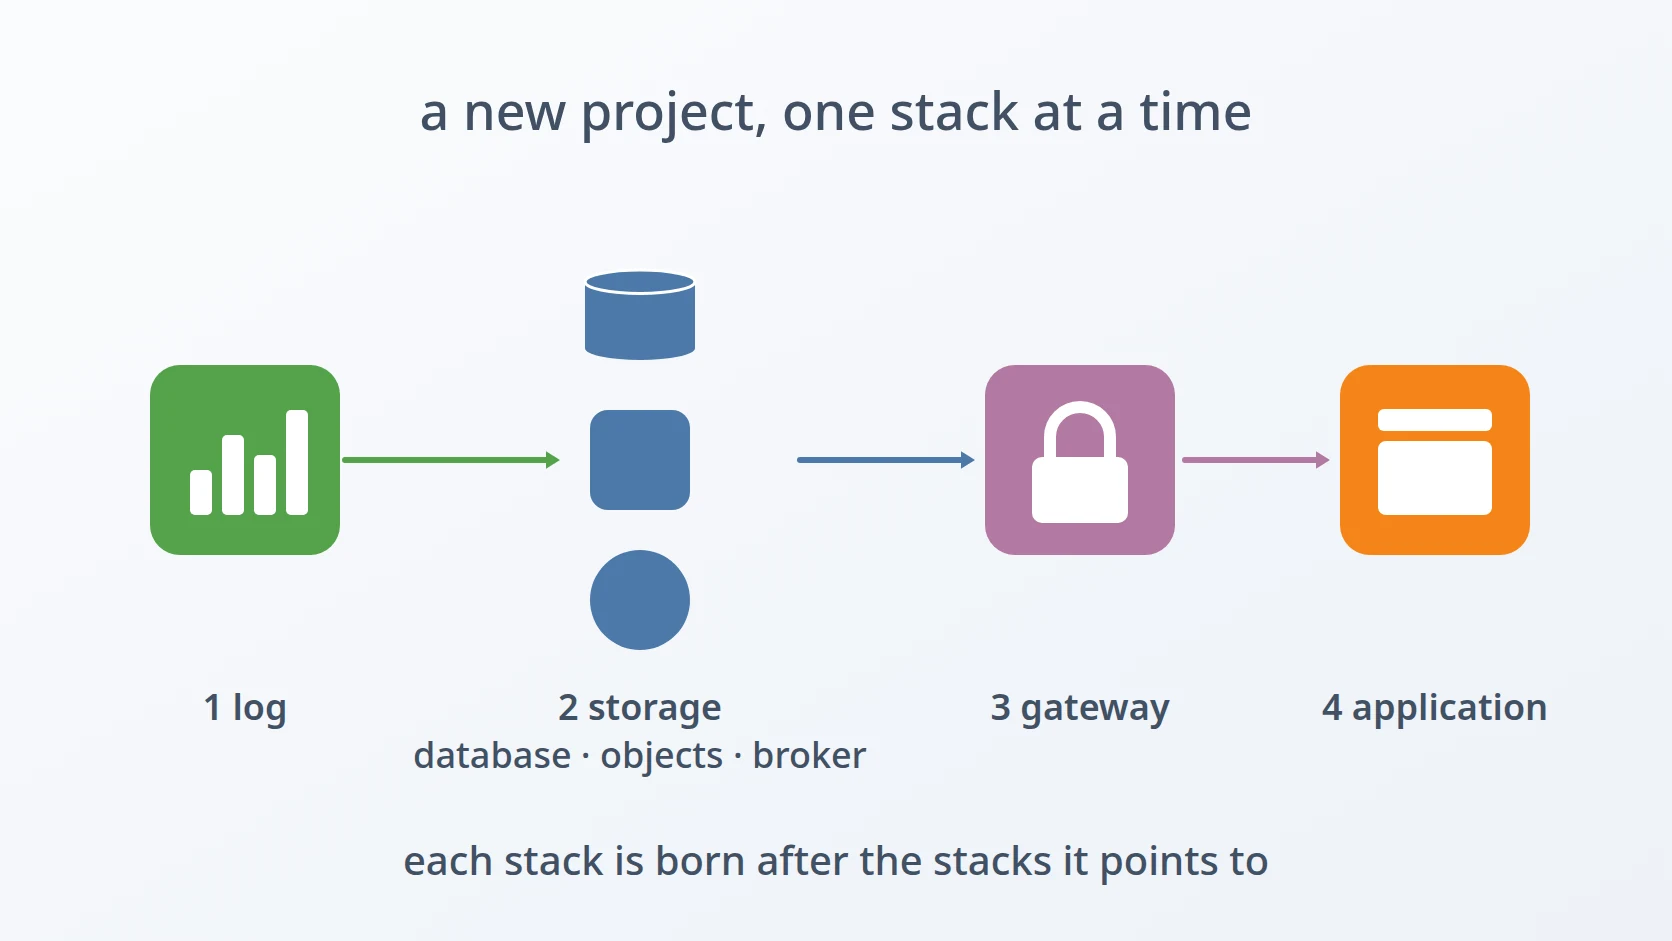
The three services have to start in an order none of them enforces. Kibana needs its password set in Elasticsearch before it can start. The collector's index templates build on settings that only Kibana registers, so setting up Elasticsearch before Kibana is ready fails. Starting everything at once and setting up afterwards is the rejected alternative, because each step depends on another having finished.
A single node needs zero replicas, without losing the official telemetry mappings. A replica cannot live on the same node as its primary, so every index on one node stays yellow unless replicas are set to zero. A catch-all template that sets zero replicas for everything also replaces the official OpenTelemetry mappings, and Elasticsearch then rejects metrics with document_parsing_exception: dynamic template 'gauge_long' not found. That catch-all template is the rejected alternative.
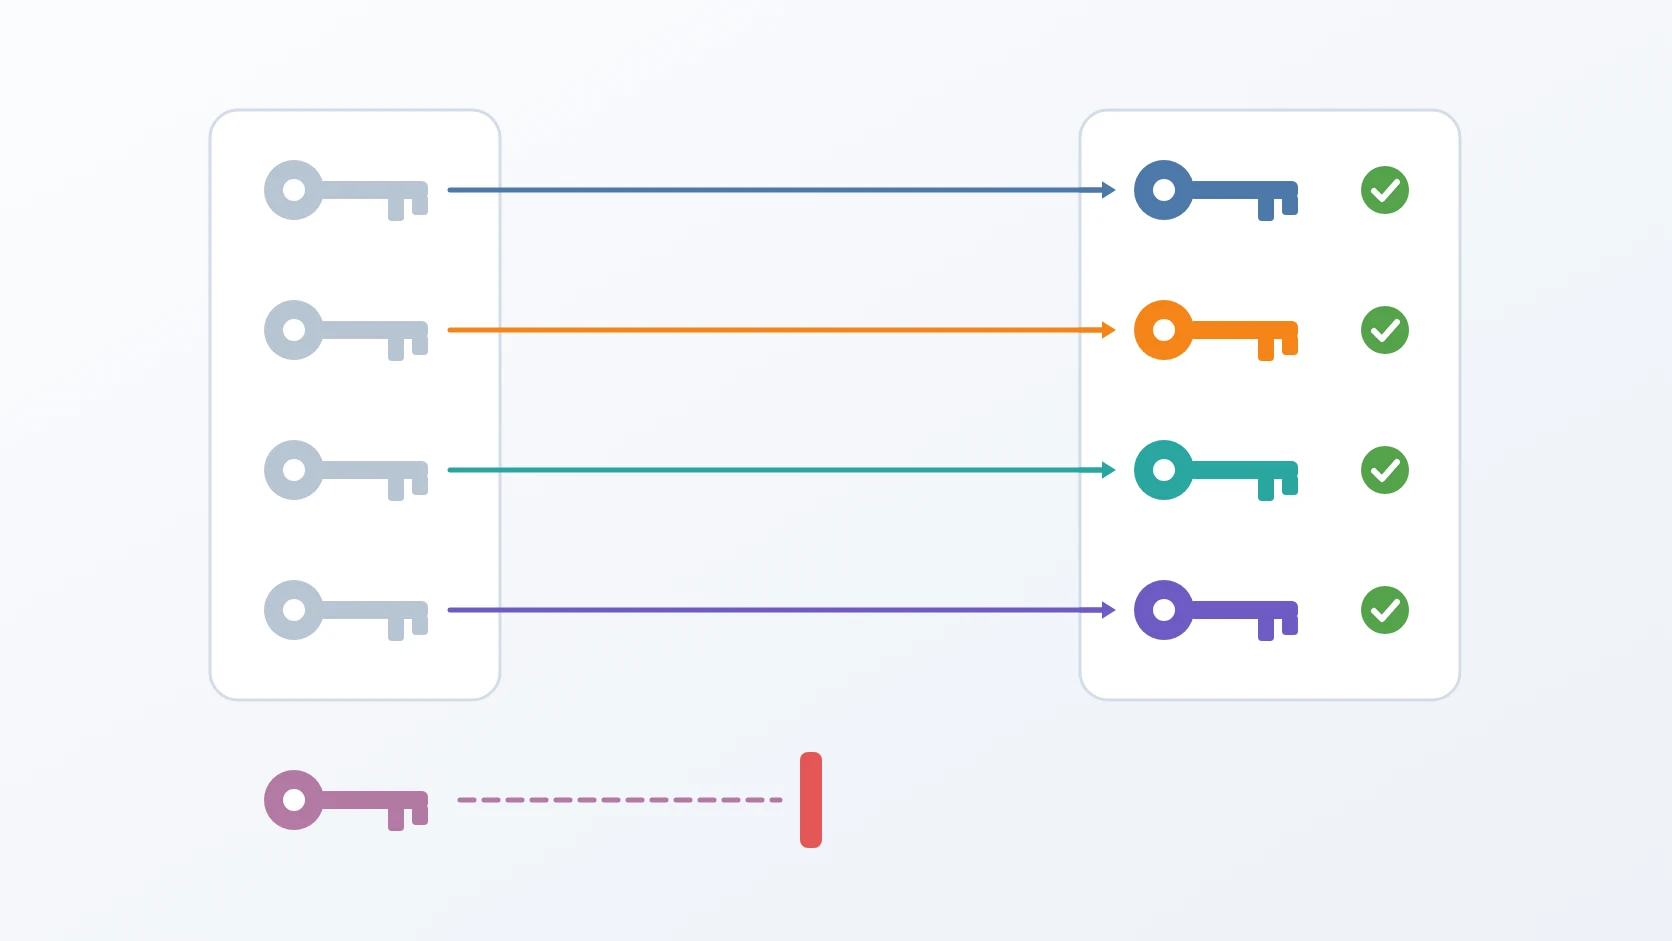
The collector must not write as the superuser. Giving the collector the built-in administrator's password is the rejected alternative: it would let a component that only ever appends telemetry delete indices, change security settings, or read everything. It needs its own user and a role limited to its own data streams, created by the same generator, every time.
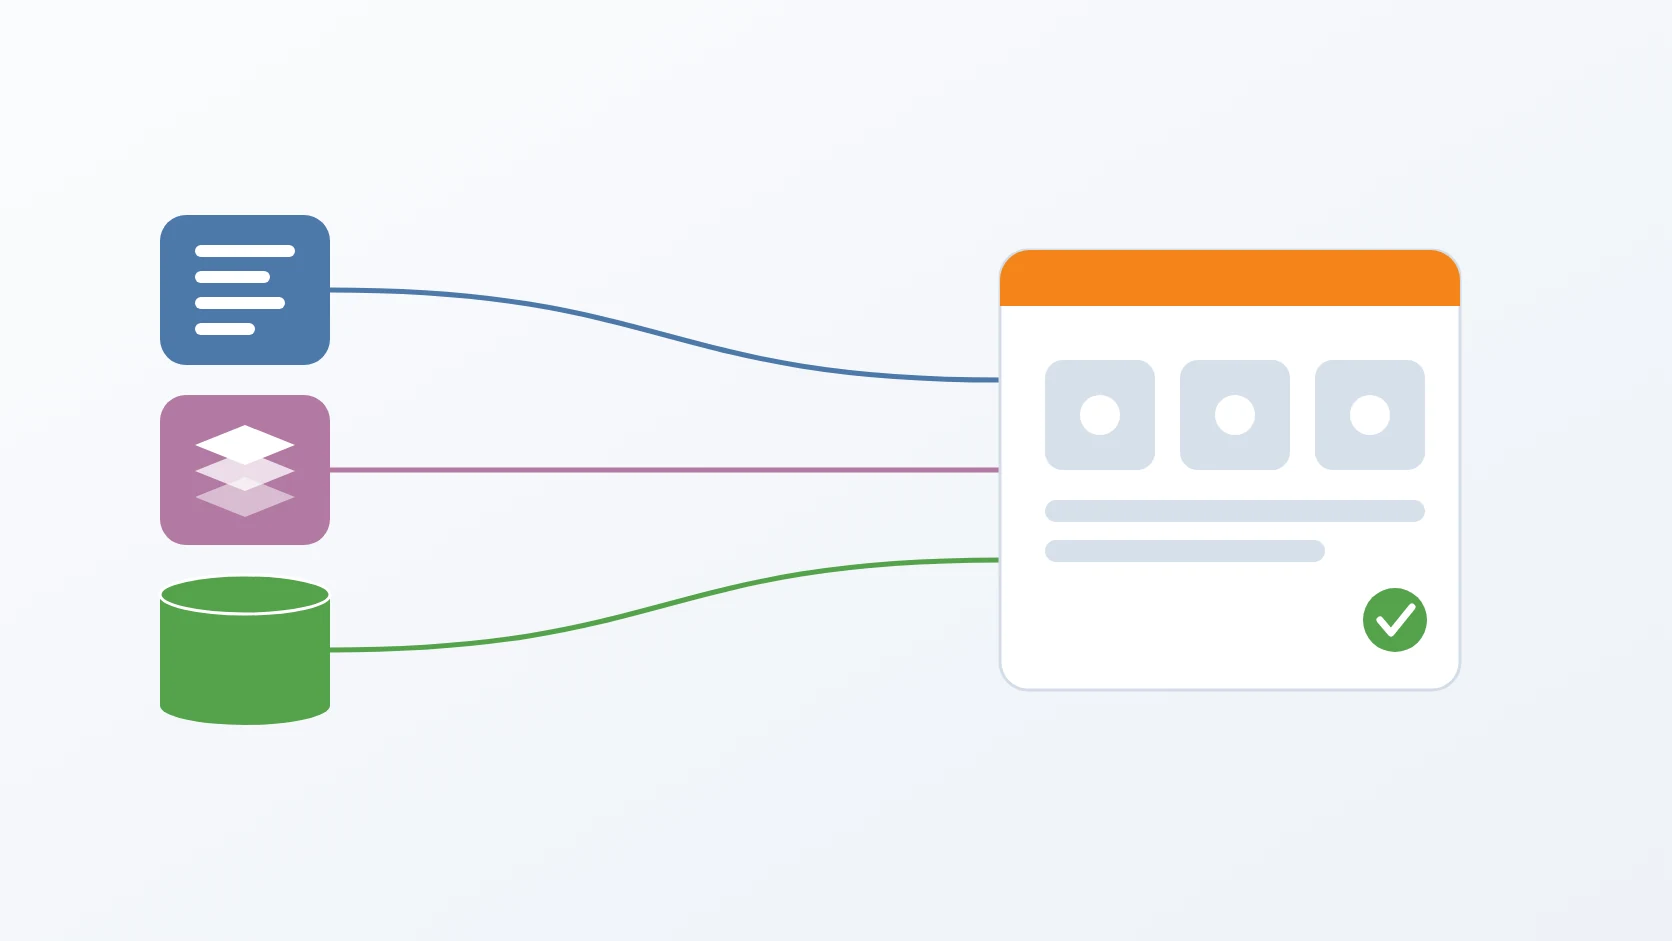
Dashboards point at data views by identifier. A dashboard saved in a file refers to the data views it reads by their identifiers, so importing dashboards before those data views exist, or into data views created with random identifiers, leaves panels that show nothing. Building the data views by hand in the interface is the rejected alternative.
The order follows the life of the stack. The first obstacle is met while the host is prepared, the second when Elasticsearch first starts, the third while the services start one after another, the fourth and fifth while the stack is set up to receive its first data, and the sixth while it is set up to show it.
Method
A. Creating the data directory before Docker does
Here is the answer to the first obstacle: the generator creates the data directory itself, as the user who runs it, before the containers ever start. Docker then finds the directory already there and leaves its ownership alone. On my machines that user usually has the same numeric id as the user inside the Elasticsearch container, so the database can write to it.
The path has a prefix because every stack on my servers keeps its data under one top-level directory, laid out like the folders the stacks run from. The compose file mounts the prefixed path, so the generator has to create the directory there, not inside the stack's own folder. Creating it in the folder would look correct and leave the real mount point to Docker, and to root.
B. Letting one node be healthy on a small disk
The template turns the disk watermarks off for this single-node cluster, with a comment that names the reason: a lab node must not be blocked just because the host's disk is tight, or the cluster never turns green or yellow and the health check that everything else waits for never passes.
log.elasticsearch:
  environment:
    - discovery.type=single-node
    - cluster.routing.allocation.disk.threshold_enabled=false
The cost is that nothing stops Elasticsearch from filling the disk, so the retention of each data stream, not a watermark, is what keeps the disk from running out.
C. Starting in the order the services need
I made the generator not rely on the services to wait for each other. It starts them, then walks through the dependencies explicitly. The collector is the one service that can express its dependency in the compose file, so it does: it starts only after Elasticsearch reports healthy.
log.otel-collector:
  depends_on:
    log.elasticsearch:
      condition: service_healthy
Once Elasticsearch is healthy, the generator sets the password of Kibana's built-in account, because Kibana cannot start without it. Then it waits until Kibana reports itself available. Then it waits once more, for one specific component template that Kibana registers during its first start. The collector's index templates are composed from such built-in components, and asking Elasticsearch for an index template whose components do not exist yet fails with a 400 error naming the missing component.
for; do
code=""
&& break
That second wait exists because Kibana reporting itself available turned out not to mean the components were in place yet; sometimes they arrived a few seconds later. Waiting for the exact thing that is needed, rather than for a status that usually implies it, removed the last intermittent failure from the setup. Only after that does the generator create the index templates, and only after those does it build the data views and import the dashboards.
D. Zero replicas without losing the official mappings
The replica setting now lives in one small component template of its own. The old catch-all template is deleted if a previous version left it behind, and three index templates, one per signal, are each composed of the official OpenTelemetry components plus that one component. Every data stream gets zero replicas, and none loses its official mappings.
PUT _component_template/__SLUG__-otel-replicas
PUT _index_template/__SLUG__-logs-otel
Composing rather than overriding is what makes it safe to update: when Elasticsearch ships new official components, the templates pick them up, and my addition stays one setting.
E. A collector that can only write its own data
The setup script creates a role whose index permissions cover only the collector's data stream patterns, and a user that holds only that role. The collector authenticates with that user; the superuser's password is used by the setup script alone and never reaches the collector's configuration.
Every definition in the setup is written whole — templates and roles with PUT, the old catch-all template deleted only if it exists, data views created only when missing — so running it again leaves each object as it was rather than creating a duplicate. That makes it safe to rerun after a partial failure, and safe to run against an existing stack to bring it up to date. Data streams created before a corrected template keep their old settings until they roll over, so the script has an option to roll them over on purpose.
F. Data views before dashboards
The data views are created with fixed identifiers, each skipped when it already exists, and only then are the dashboards imported from files kept with the template, which refer to those identifiers. Importing with overwrite enabled makes the step idempotent like the rest: running it again replaces each dashboard with the same one instead of adding a copy.
Results and Discussion
A. What one command produces
One run asks for the project name, the Docker network — whether it already exists, its subnet when it has to be created, and the address to bind ports to — the collector's username, and three passwords — for the superuser, the collector's user, and Kibana's account — and writes a folder with the compose file, the collector's configuration, an environment file, and the setup scripts. When asked, it starts the stack and completes the setup: the index templates, the collector's role and user, three data views, and four dashboards for forensic audit, errors and reliability, performance and traffic, and service health.
The first telemetry a service sends is visible on the dashboards without anything being configured by hand. Every object the stack creates carries the project's name: the template names everything with placeholders in a lowercase and an uppercase form, the generator renames the files that carry one and replaces both in a single pass, and the identifier itself is the project's domain-style name with dots and dashes turned into underscores, so that my-project.example.com becomes my_project_example_com.
for; do
|| continue
base=""
done
| B. Running it without a person at the keyboard
As with my other generators, every question can be answered through an environment variable of the same name, and one variable skips every confirmation, so the same script serves both an interactive setup and an automated test of the generator itself. The address the ports are bound to is read from Docker's own description of the network rather than computed from the subnet.
PROJECT=my-project.example.com NETWORK=my-project.net \
C. Where this stops
The stack is deliberately small. Elasticsearch runs as a single node, which is why the replica and disk settings above exist. Traffic between the services stays on an internal Docker network over plain HTTP with authentication, not TLS. And the collector's image has no shell, so it cannot run a health check inside its own container; its health endpoint stays available to be probed from outside instead. A project that outgrows one node needs a different design, not a bigger version of this one.
Conclusion
The generator turned a log stack from something assembled by hand into something a new project receives in one command, already able to show its first trace. Most of the work was not in the containers but around them: creating a directory before Docker could create it wrongly, letting a single node be healthy on a small disk, walking through a start-up order none of the services enforce, giving the data zero replicas without losing the official mappings, giving the collector exactly the rights it needs and nothing more, and building the data views before the dashboards that point at them. Each of those is now written once, in the generator, instead of remembered on every new project.
Terms
- OpenTelemetry
- An open standard and set of tools for producing and collecting logs, traces, and metrics from applications.
- OTLP
- The OpenTelemetry protocol, used by services to send telemetry to a collector over gRPC or HTTP.
- Collector
- A service that receives telemetry from many sources, processes it, and forwards it to storage.
- Data stream
- An append-only series of indices in Elasticsearch, used for time-ordered data such as logs.
- Index template
- The settings and field mappings Elasticsearch applies to every new index whose name matches a pattern.
- Component template
- A reusable piece of settings or mappings that index templates are composed from.
- Data view
- A Kibana definition that says which indices or data streams to read, used by dashboards and searches.
- Bind mount
- A directory on the host made available inside a container at a given path.
- uid
- The numeric user identifier that the operating system uses to decide who owns a file.
Technologies covered
- Bash
- Elasticsearch
- Docker Compose
- Kibana
- OpenTelemetry