How I Centralise Logs, Traces and Metrics Across a Multi-Service System
On this page
- Introduction
- A. What the three tools are, and why each one is there
- B. Five obstacles in the way
- Method
- A. One collection point, and a collector that does nothing clever
- B. The restart that always ate the first minutes
- C. Two traps I wrote down so I would not repeat them
- D. Instrumentation: three languages, one shape
- E. Propagation: how one transaction stays one transaction
- F. The boundaries that are not HTTP
- Results and Discussion
- A. What logs are for, once traces exist
- B. The audit event that was stored twice
- C. Metrics, and the cost of a careless label
- D. Storage, mappings, and the template that would break only metrics
- E. Reading it: data views, a runtime field, and dashboards as artefacts
- Conclusion
- Terms
A system that runs as one process has one place to look. You attach a debugger, you tail a file, and the question of where something happened does not arise because there is only one answer. Split the same application across a dozen containers and that question becomes the expensive one. A user reports that signing a document failed. It failed somewhere across a gateway, an API, a signing service and two external authorities, and each of them logged something locally, to itself, in its own format.
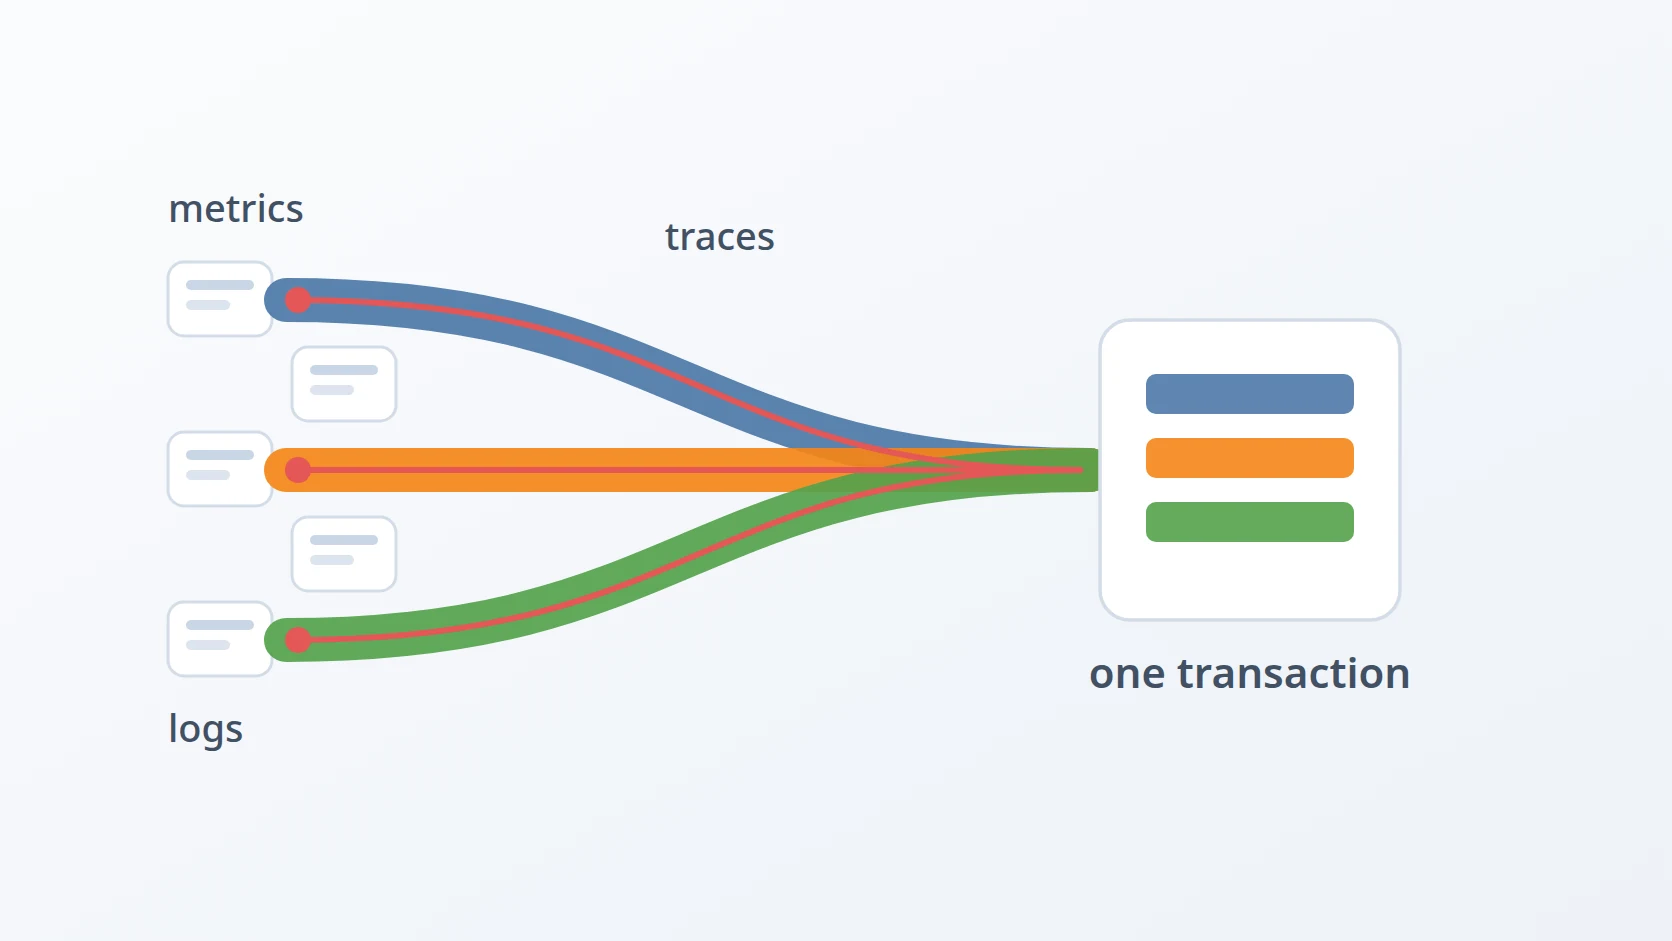
What I want in that moment is not more logs. It is the ability to take one identifier and reconstruct one transaction across every service it touched, in order, with durations. That is a different thing from logging, and building it changed how I instrument code. This article is about that shape — one collection point, three signals that agree with each other — and about the failures that taught me more than the design did.
Introduction
The instinct when logs are scattered is to centralise the logs and stop there. I have done that, and it solves less than it promises. You end up with every line from every container in one searchable place, which is a real improvement, and you still cannot answer the question that made you build it. A thousand lines from five services interleaving does not become one transaction just because they share a screen.
Before going further it is worth being plain about the words, because three of them do most of the work in this article and they are not interchangeable. A log is a line of text a program writes to say what it just did. A trace is the record of one request as it travels through a system, made of nested spans — a span being a single named operation with a start, a duration, and a parent. Metrics are numbers sampled over time, such as how many requests arrived this minute and how long they took.
What was missing was not volume, it was structure. Three specific pieces of structure, which correspond exactly to the three signals defined by OpenTelemetry — an open standard, with libraries for most languages, for how programs record logs, traces and metrics and send them elsewhere — and which I now think of as answers to three different questions rather than three formats for the same data.
Traces answer where did this request go, and what took the time. They are the causal structure: a tree of operations, each with a parent, each with a start and a duration.
Logs answer what did the code decide, and why. They are the narrative a trace cannot carry — which branch was taken, which validation failed, which record identifier was involved.
Metrics answer is this normal. They are the only signal that describes the system rather than a request, and the only one cheap enough to keep at full fidelity forever.
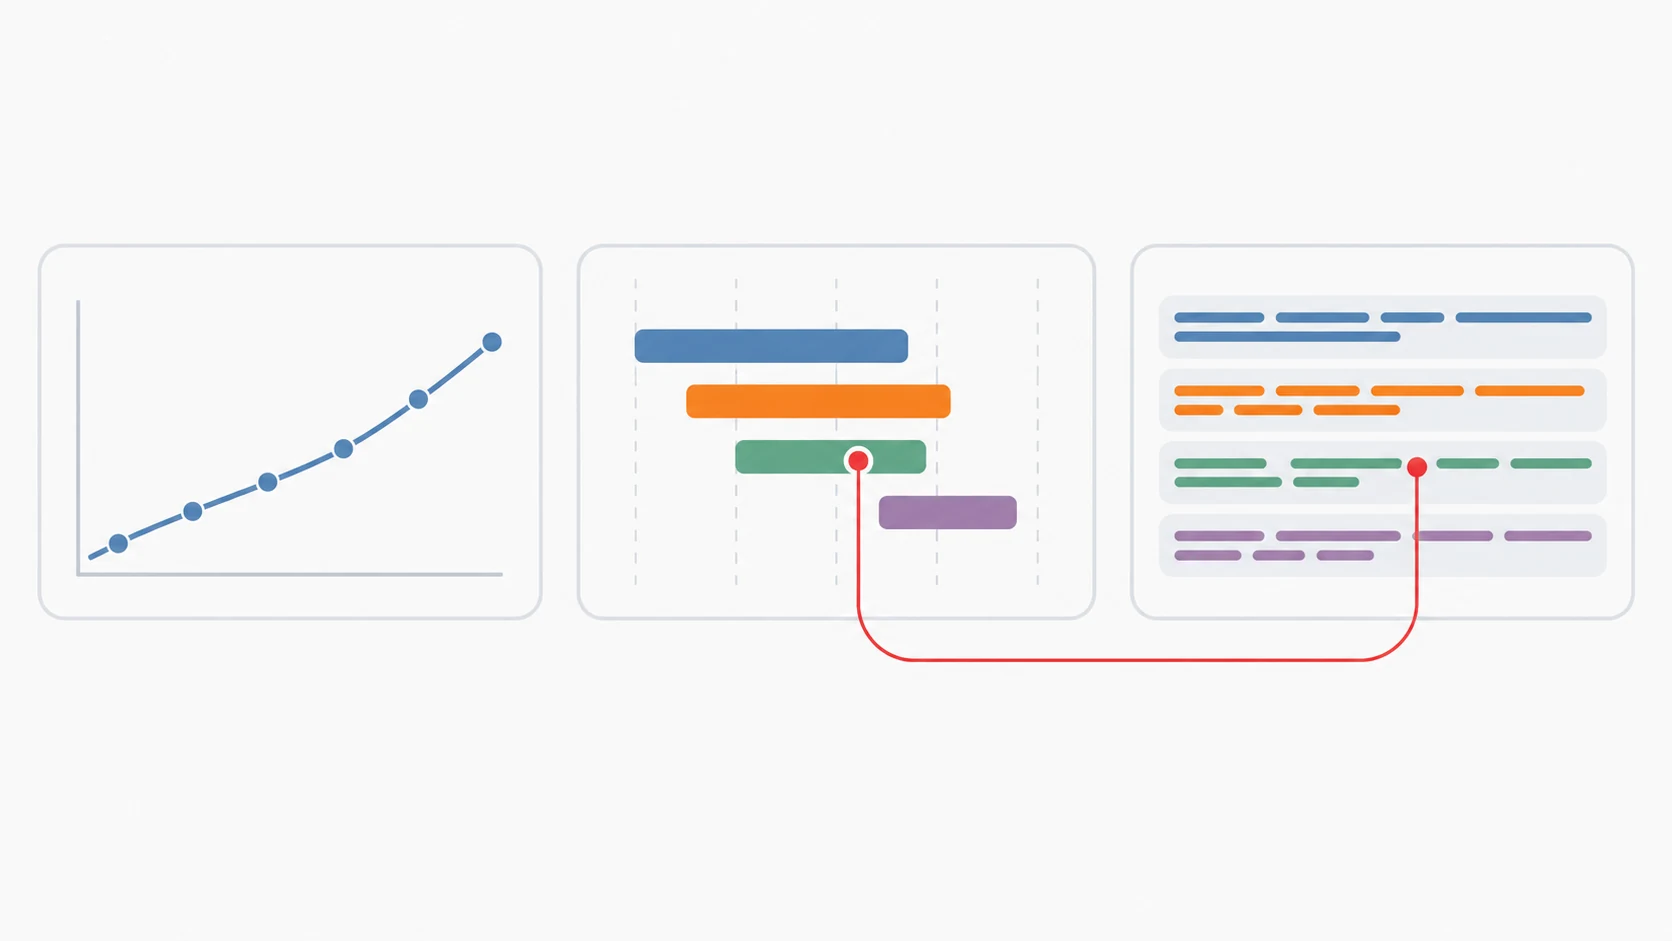
None of these substitutes for another. A trace with no logs tells you a span took four seconds without telling you what it was waiting for. A log with no trace tells you what happened without telling you what it was part of. Metrics tell you the error rate tripled without giving you a single example to examine. The value is not in any one of them; the value is in the fact that all three can be joined back together.
Three signals are not three ways of looking at a system. They are three different questions, and the design is worth nothing unless their answers can be joined back together.
The joining is done by one field. Every log record carries the trace and span identifier of the operation it was emitted from; every metric carries the same resource attributes as the spans from that service. Take one trace identifier, look it up in the traces view, search for it in the logs view, and you have reassembled the transaction. That single correlation is the whole point of everything that follows.
A. What the three tools are, and why each one is there
The stack that does this is three pieces, and it is worth saying what each one is before saying how they are wired, because the names are often used as if everyone already knows them. None of the three is doing anything mysterious; each solves one specific problem that the other two do not.
Elasticsearch is a search engine that stores documents and indexes every field in them. That is an unusual choice for telemetry until you consider what you actually do with telemetry: you almost never read it sequentially, you search it. You want every record from one service in a five-minute window where the status was 500, sorted by duration. A plain file cannot answer that without reading everything; a relational database can, but you would have to decide the columns in advance, and telemetry attributes vary per service and change whenever a developer adds one. Elasticsearch indexes whatever fields arrive, which is exactly the shape of the problem.
The OpenTelemetry Collector is a small process that receives telemetry from applications and forwards it to storage. The obvious question is why it exists at all — each service could write to Elasticsearch directly. It exists because that direct arrangement puts the storage password in every service, makes every service responsible for retrying when storage is down, and means changing the storage backend requires changing and redeploying every application. With a collector in the middle, each service knows exactly one address and one protocol. Everything else is a configuration file in one place.
Kibana is the reading surface for Elasticsearch: it turns queries into tables, charts and dashboards. It exists because the alternative is issuing search queries by hand, which is fine once and unbearable during an incident. It is also, notably, the only one of the three that a human ever opens — which matters later, because it means the security posture of the read plane is a different problem from the security posture of the pipeline.
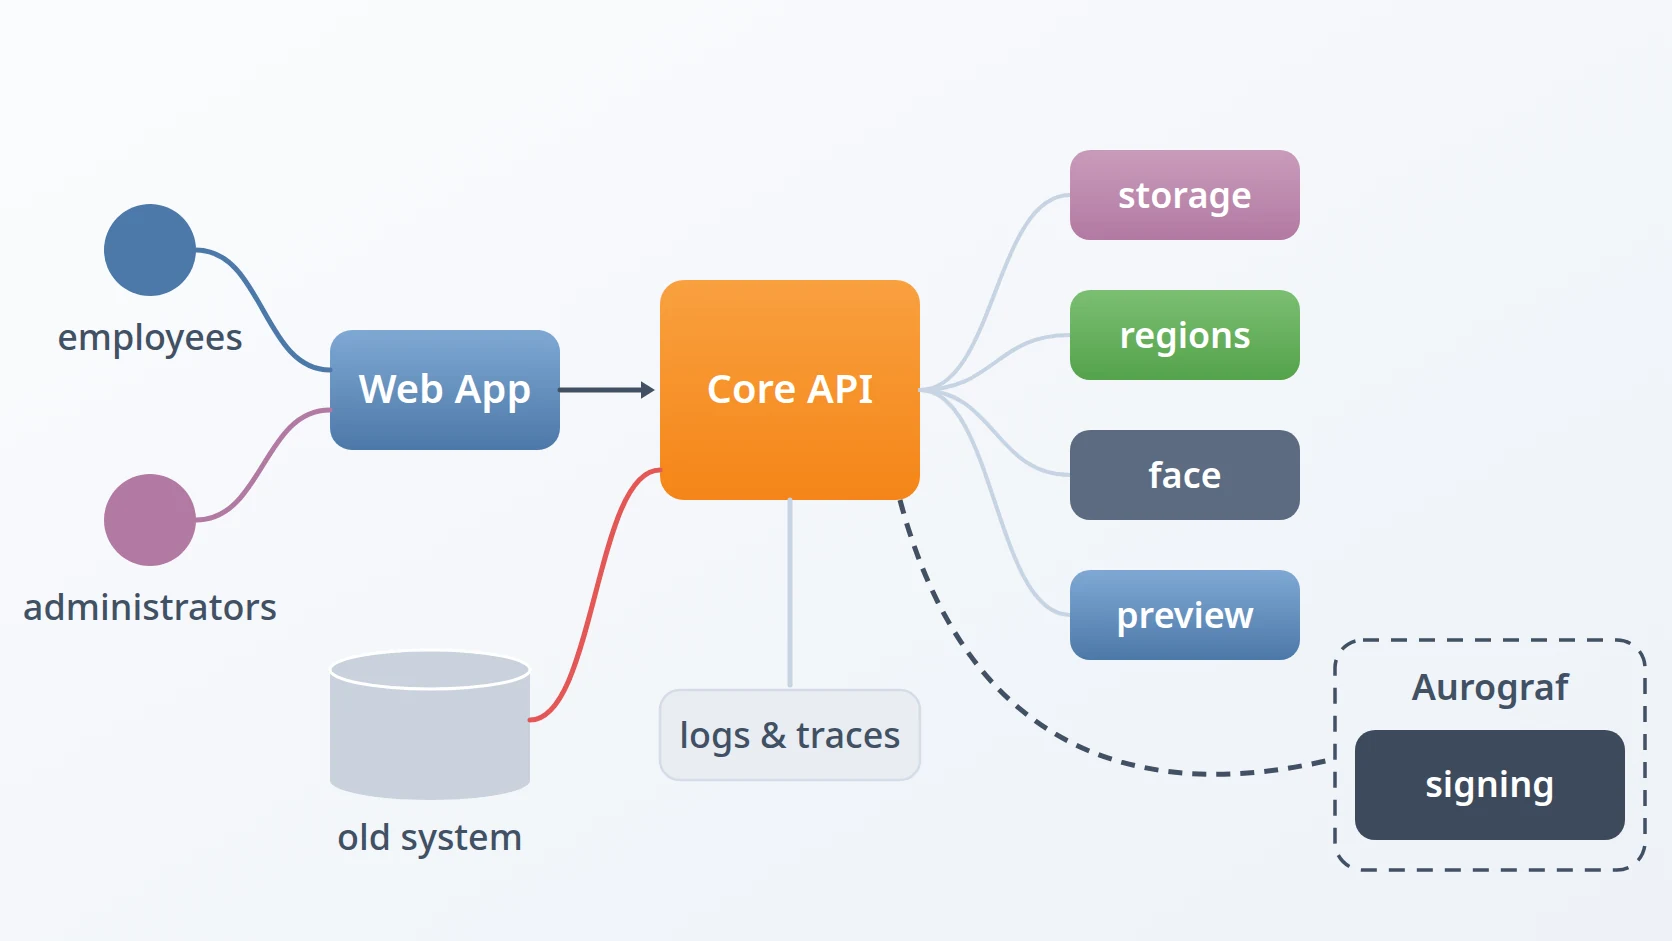
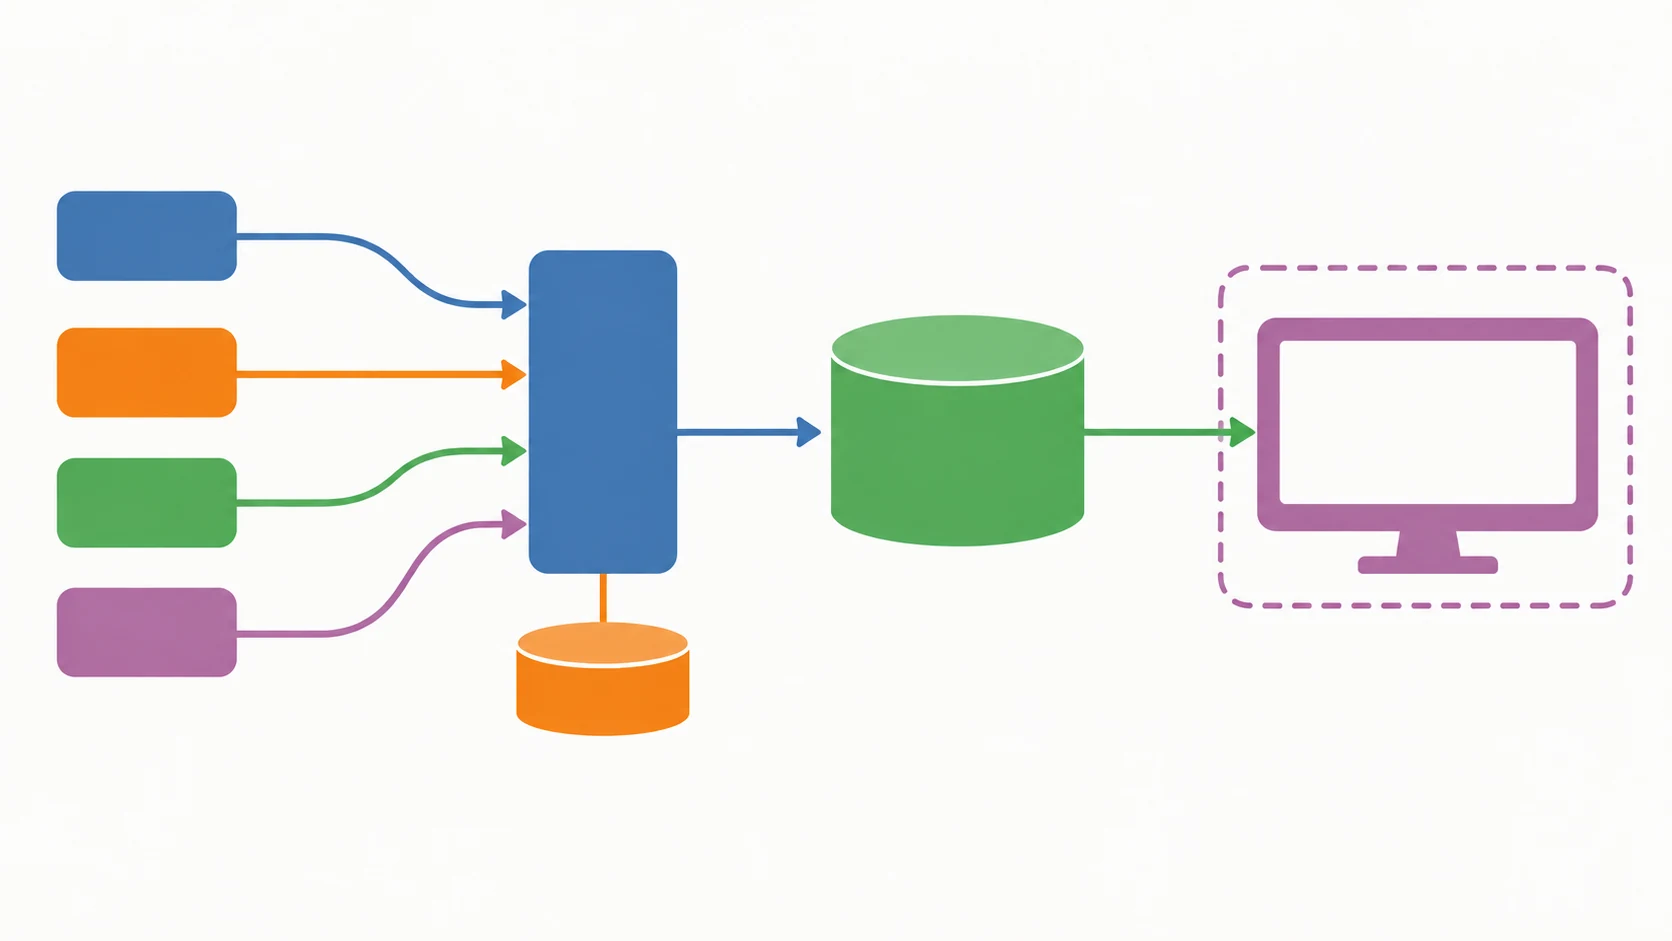
Put together: applications push telemetry to the collector, the collector forwards it to Elasticsearch, and Kibana is where you go to read it. The rest of this article is about the decisions inside that sentence.
B. Five obstacles in the way
What I wanted from all of this fits in one sentence. Take a single identifier from a user's complaint, and reconstruct the whole transaction it belongs to — every service it passed through, in order, with durations and with the decisions each service made along the way. And do it under two constraints that turned out to matter more than the goal itself: without asking developers to thread anything through their own code at every call site, and without the telemetry ever becoming a thing that can take down what it is watching.
Easy to state, awkward to build. Five obstacles stood between that sentence and a system that actually delivered it, and none of them announced itself as a design problem. Each one presented as something else — a message I had stopped reading, a number that looked fine, a component that kept working.
The first is that a restart can silently eat the first minutes of telemetry. Not an outage, not an error — simply an absence, at exactly the moment I was most likely to be watching. The tension is that a collector must not hold data forever and must not throw it away either, and the default settings resolve that tension in favour of throwing it away. Only two things have to be true at once: a retry window that expires before the store finishes becoming ready, and a queue that holds the data in the meantime only in memory. The obvious guard does nothing here — a depends_on health condition in the compose file is genuinely enforced and genuinely useless, because it reports that a container has started passing a health check, not that the service behind it will accept a write. Widening the retry window alone is the other tempting answer, and it would hide this particular startup race while leaving every longer outage just as destructive.
The second is that an audit event can be stored twice while nothing fails. Writing every audit event both as a log record and as an event attached to the active span looks like belt and braces and is in fact a correctness bug — because span events do not land in the traces data stream, they land in the logs one, right next to the ordinary log record. Two documents, one event, a millisecond apart, with nothing in either marking it as a copy of the other. An audit trail is a claim about how many times something happened, so a mechanism that can quietly double its rows is not untidy, it is wrong. The alternative I had to give up was the comfortable one: keeping both writes and deduplicating at read time, which puts the burden on every future query instead of on the one place that emits.
The third is that an index template of my own can quietly overwrite the official mappings. A template broad enough to catch the telemetry indices also matches — and replaces — the mappings the exporter installs for itself. Everything keeps working except metrics, which are the one signal strict enough about field types to complain, so a single misconfiguration presents as a problem with one signal rather than as damage across all three. Letting the defaults stand with no template at all was the alternative, and it gives up the settings that are genuinely mine to choose.
The fourth was that one transaction stops being one transaction at every boundary that has no request and response to carry a header. A trace exists only because each service tells the next which trace it belongs to, and that handover has to be injected by every caller and extracted by every callee. Miss either half at a single hop and nothing errors — the trace quietly splits into two unrelated traces, each of which looks complete on its own. The boundaries that break it are the ones with no request-response pair at all: a message queue whose consumer matches on one specific string type and silently ignores any other, a background job that crosses a boundary in time rather than in space, and a worker thread that leaves the context behind in thread-local storage. The alternative I had to rule out was the one that looks harmless — formatting the trace header by hand instead of going through the SDK propagator, which works until the day the format gains a field.
The fifth was that one careless label degrades the store rather than the code. A metric labelled with the raw request path instead of the route template creates a new time series for every distinct URL, so a site with ten thousand articles has ten thousand series for a single instrument. Nothing fails; the store simply gets slower and larger until somebody investigates. The rejected alternative was labelling with the path exactly as it arrived, on the reasoning that it carries more information — it does, and the information is worthless at that cardinality, because no query can usefully group by a dimension that never repeats.
The order is not the order I met them; it is the order they have to be solved in. The first comes first because until telemetry reliably arrives, none of the others is visible — a duplicate you never received is not a duplicate you can count. The second precedes the third because of how each was found: the duplication was only ever going to be caught by counting documents and comparing the total against what should have been there, while the template failure was noisy enough to find me on its own. The fourth and fifth come last because both are about what the data means once it is safely stored rather than whether it arrives at all — a split trace and an exploded metric are both perfectly well-stored data that answers the wrong question. Obstacles that fail loudly can wait. The ones that keep working are the ones worth looking for first.
Method
A. One collection point, and a collector that does nothing clever
Every instrumented service pushes to a single collector over OTLP. There is no scraping and no log file collection — no filelog receiver reading container output, no Prometheus receiver polling endpoints. The collector accepts OTLP on two protocols and nothing else, which means a service that wants to be observed must say so explicitly by sending data.
receivers:
otlp:
protocols:
grpc:
http: That choice is worth defending, because scraping is the more common default. Scraping means the collector must know every service, its address and its port, and that list becomes a second deployment artefact that drifts. Pushing inverts the dependency: the collector knows nothing about who talks to it, and adding a service is a change to that service alone. The collector configuration has not changed in months across three separate deployments, because there is nothing in it that names anybody.
The processor chain is two entries long, and their order is the load-bearing part.
processors:
memory_limiter:
batch: The memory limiter must come first. Its job is to refuse data when the process is close to its ceiling, and it can only do that if it sees the data before anything else accumulates it. Put the batcher first and you have built a component whose whole purpose is to hold data in memory, sitting upstream of the component whose whole purpose is to prevent data being held in memory. The limiter then reports pressure that the batcher created and is powerless to relieve.
Beyond those two, the collector does nothing. No enrichment, no filtering, no attribute rewriting, no sampling. I think of it as a deliberately dumb pipe, and that is a design decision rather than an unfinished configuration. Every piece of semantic structure — the service name, the route template, the outcome of an operation — is produced by the application that knows it. A collector rule that infers meaning from a path or a header is a second, weaker copy of knowledge that already exists at the source, and it will disagree with the source eventually.
One more thing about shape: there is a single exporter shared by three pipelines, not one exporter per signal. Logs, traces and metrics all route to the same exporter, which knows how to place each signal itself. The alternative — three near-identical exporter blocks — is three places to update credentials and three opportunities for them to differ.
B. The restart that always ate the first minutes
This is the answer to the first obstacle: the telemetry that never survived a restart.
The stack had a symptom I tolerated for longer than I should have. Every time it restarted, the first minutes of telemetry were missing. Not corrupted, not late — absent. The collector said so plainly, and I had read the message often enough to stop seeing it.
The reading is straightforward once written down. The collector came up, tried to deliver, found the store refusing connections, retried, ran out of retries, and discarded what it was holding. Two independent causes had to both be true for data to be lost, which is why the fix needed two parts.
The first is arithmetic. A retry policy of five attempts with the default backoff exhausts in roughly thirty seconds, and the store needs appreciably longer than thirty seconds to become healthy from cold. The mismatch is small enough to look like bad luck, with retries giving up shortly before the destination becomes ready.
The second is where the data waits. With the sending queue in memory, exhausting the retries does not defer the data — it destroys it. A queue in memory is not a buffer against an outage. It is a buffer against a hiccup, and it converts anything longer into loss.
The observation I keep returning to is about the thing that was supposed to prevent this. A dependency with a health condition in the compose file is genuinely enforced, and it still holds nothing back when both containers start within the same second and the store reports healthy at the moment the collector asks. A startup ordering condition tells you a container has begun passing its health check. It does not tell you the service behind it is ready to accept writes, and the gap between those two facts is where telemetry disappears.
extensions:
  file_storage:
    directory: /var/lib/otelcol/storage
sending_queue:
  storage: file_storage
retry:
  max_retries: 8
  initial_interval: 5s
  max_interval: 60s
So the queue waits on disk, and the retry window is about five minutes instead of thirty seconds. The disk queue is the more important half. It changes the failure mode from "telemetry is lost while the store is down" to "telemetry is delayed while the store is down", and delayed data still answers questions later. Widening the retries alone would have papered over this particular startup race while leaving any longer outage just as destructive.
C. Two traps I wrote down so I would not repeat them
Both are the kind of thing that is obvious in hindsight and invisible in advance, so I keep each as a dated note beside the configuration it concerns.
The first is that the obvious field for expressing a retry window is rejected. Setting max_elapsed_time is the natural way to say "keep trying for five minutes", and it belongs to the generic retry helper rather than to this exporter's retry block. The collector refuses to start, reports that the retry section has an invalid key, and enters a restart loop — a total telemetry outage caused by a change intended to make telemetry more reliable. The window has to be expressed indirectly instead, as a count of retries and the intervals between them.
The second is a permission problem with an unusually bad blast radius. The collector's process runs as a non-root user with a high, unremarkable identifier, and it is not the identifier that owns the other data directories in the same stack. Creating the queue directory without setting ownership to match produces a collector that cannot write its own queue and therefore will not start. The cost of getting it wrong is every service losing telemetry indefinitely, to fix a fault that costs seconds of data per restart.
Which is why the configuration is now validated before the running stack is touched at all. The collector image can check a configuration file without starting a pipeline, and running that as the same user the container will use catches both classes of error in one command. No output means valid.
I tested the design by breaking the system on purpose: killed the store, sent traffic, brought it back. The queue on disk held three files and about 112 KB while the store was gone. There were no drop messages at startup, traces and metrics both recovered their backlog, and the public site served normal responses the whole time. One detail from that test is in the results below, because it taught me something about logs.
D. Instrumentation: three languages, one shape
Four services across three languages are instrumented, and the thing I care about is that they have the same shape rather than the same code. All of them export all three signals. All of them speak OTLP over HTTP with protobuf encoding to the same port, never gRPC, and all of them construct the per-signal URL by appending the path to a single configured endpoint — so one environment variable moves every signal for every service.
Choosing HTTP over gRPC is not about performance, because at this volume there is nothing to gain. It is about how few dependencies each service needs. It matters most in the PHP service, where OTLP over HTTP goes out through the ordinary HTTP client the framework already ships, and needs neither a compiled extension nor a gRPC stack. A telemetry client that requires a native extension is a telemetry client that will eventually block a runtime upgrade.
The Rust services show the structure most clearly, because all three signals are visible in one expression. A single subscriber registry carries three layers: human-readable output for a terminal, a bridge that turns spans into OTel traces, and a bridge that turns log statements into OTel log records.
registry
.with
.with // stdout, for humans
.with // spans -> traces
.with // events -> logs
.init;What that buys is that ordinary code stays ordinary. A developer writes an instrumented function and a log statement using the same API they would have used with no telemetry at all, and the correlation happens in the layer rather than at the call site. The same principle appears in the other two languages by different mechanisms: a standard-library logging handler in Python that reads the currently active span, and a scope-activated log path in PHP.
In Python that bridge is two lines. A handler from the SDK is attached to the root logger, and from then on every ordinary logging call in the service is also an OTel log record stamped with whatever span is active at the time.
# Bridge stdlib logging -> OTel logs, correlated with the active span.
=
Every service sets the same resource attributes: a service name, a namespace, a version taken from the build metadata, and a deployment environment. These are the fields that make a dashboard filterable and make "is this only happening in one environment" a question with an answer.
There is one rule above all of this, and I state it as a rule because it decides the design of every initialisation path: telemetry must not become a failure point. When telemetry is disabled or misconfigured, each service falls back to a plain local logger — the Rust service to a formatting subscriber, the Python service to basic logging configuration, the PHP service to no-op providers swapped in behind the same interfaces. Nothing anywhere branches on whether telemetry is on. A monitoring system that can take down the thing it monitors has inverted its own purpose.
E. Propagation: how one transaction stays one transaction
This is the answer to the fourth obstacle, and this section covers the boundaries that do carry a header. The next one covers those that do not.
A trace only exists because each service tells the next one which trace it is part of. That happens through one header carrying the trace identifier, the current span identifier and a flag, and it has to be injected by every caller and extracted by every callee. Miss either half at any hop and the trace does not error — it silently splits into two unrelated traces.
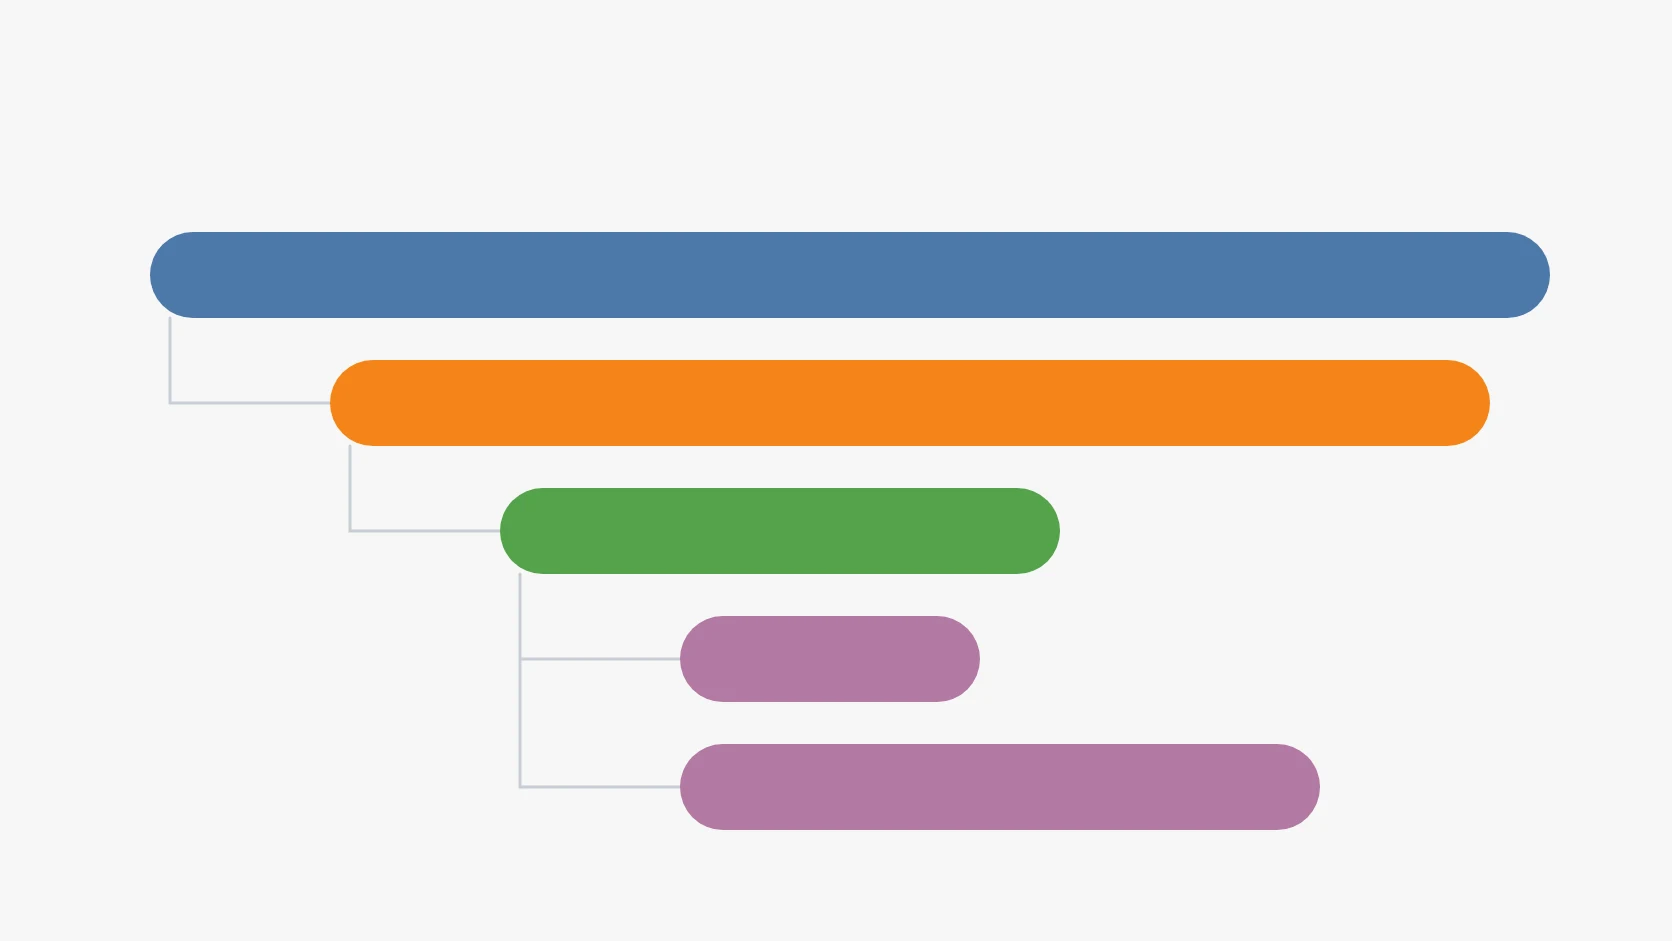
On the receiving side, a server extracts the inbound context and makes its own span a child of it. The comment in the source names the failure precisely, because a future reader deleting this line would see nothing break.
// Extract inbound `traceparent` so this span becomes a child of the caller's
// trace rather than a new root — the parent breaks here if this is skipped.
let parent_cx = extract_context_from_headers;
let span = info_span!;
let _ = span.set_parent;A second comment nearby is equally important: for requests that do not arrive through the gateway there is no inbound header, and the span is legitimately a root. Without that note, the first person to see a root span in a service that is usually downstream will go looking for a propagation bug that does not exist. Documenting the expected absence is as useful as documenting the requirement.
On the sending side, the gateway injects the context into the outbound request. Its position in the code is deliberate and is written down as an invariant, because header handling on a gateway is a security boundary as well as an observability one: drop hop-by-hop headers, strip client headers that a caller could spoof, set the trusted values, append the forwarding chain, and only then propagate the trace context. Injection is last precisely so that it happens after the spoofable set has been removed, and can never be the mechanism by which a caller-supplied header survives.
// Propagate W3C trace context (traceparent) to the backend.
for in inject_context In PHP the same operation carries a trap that is worth more than the code. The global propagator is a no-op until something explicitly registers one, so the idiomatic-looking call injects nothing at all, succeeds, and produces broken traces. Naming the propagator directly removes the dependency on registration order having happened somewhere else.
In Python almost none of this is written by hand. Instrumenting the web framework gives both the server span and the extraction; instrumenting the HTTP client gives both the client spans and the injection. Two calls at startup buy both halves of the propagation contract for every route and every outbound request in the service.
# Server span per request, and extraction of the caller's traceparent.
# Client spans for outbound calls, and injection of traceparent downstream.
What remains worth writing manually is a named span around a meaningful unit of work, so that the library calls inside it appear as children of something that means something to a human rather than as a flat sequence of requests.
F. The boundaries that are not HTTP
Still the fourth obstacle, and this is where it actually bit.
HTTP propagation is well-trodden. The boundaries that break traces are the three where no request-response pair exists to carry a header, and each fails differently.
The message queue produced the most instructive failure, because it does not fail. Trace context travels in message headers, and the consumer matches on one specific string type when reading them. Send the same header as a different string type and the message is delivered normally, the consumer runs normally, and the header is silently ignored — the span simply has no parent, and no error appears anywhere.
// ⚠️ Trace headers MUST be LongString.
// The consumer matches `if let AMQPValue::LongString(s) = v` and silently
// ignores other types. Using ShortString breaks the trace silently: the
// message still arrives, but the consumer's span loses its parent and not
// a single error appears.
Background jobs cross a boundary in time rather than in space, and the mechanism is to treat the context as data. At dispatch the trace context is captured as a string and stored in the job payload like any other field. In the worker it is rehydrated by handing the propagator a synthetic carrier containing only that value, then activated for the duration of the job, with the detach placed in a finally block so that a failing job cannot leave an activated context behind to contaminate whatever the worker picks up next.
Thread boundaries are the subtlest, because the code looks like it stays in one place. Context is held in thread-local storage, so moving work to a worker thread leaves it behind and the resulting spans become roots. The fix is the same explicit attach and detach, inside the function that runs on the other thread, with the detach again in a finally.
One deliberate consistency across all of this: every injection and every rehydration goes through the SDK propagator, never through string manipulation. There is exactly one place in the codebase where the header is parsed by hand, and it is read-only — pulling the trace identifier out to store on an audit record, with validation and an optional return for anything malformed. That is a leaf read that cannot affect the shape of any trace. Hand-parsing confined to a leaf is fine; hand-parsing anything that determines parentage is how you get traces that are subtly wrong rather than obviously broken.
Results and Discussion
A. What logs are for, once traces exist
Log correlation is automatic in all three languages by three different mechanisms, and all three arrive at the same place: every log record carries the trace and span identifier of the operation it was written inside, with nothing at the call site. In Rust a subscriber layer stamps them; in Python a logging handler reads the active span; in PHP records are emitted while the request span is active, accumulated for the request and flushed at the end of it.
The PHP path is the odd one, and worth noting because it surprised me: correlated records go out through the OTel logger provider directly and bypass the framework's usual logging library entirely. That is a real tradeoff. It means the logging configuration a PHP developer expects to control output does not control this path, and anyone debugging "why is my handler not firing" needs to know it exists.
The consequence that changed how I write instrumentation is this: a span alone produces no log line. A successful request that logs nothing of its own leaves a perfectly good span and no log record whatsoever. I had assumed the two signals would roughly track each other and they do not — traces cover every request, logs cover only the requests where the code had something to say. So each service emits one explicit access event inside the request span, inheriting its attributes and its identifiers, which restores the ability to answer questions in the logs view without having to reason about spans first.
That is also the footnote from the outage test. When the store came back, traces and metrics both showed a clear recovery of buffered data while logs showed none — not because the queue had failed for logs, but because no service had written a log line during the window. Successful requests emit a span, not a log line. Tested separately with a service that does log, the log backlog recovered exactly as expected.
The other deliberate asymmetry is what gets dropped. Health probes run every thirty seconds forever and are of no forensic value, so they are excluded from logs — but their spans and metrics are kept, because a health check that starts taking two seconds is a real signal and the metric is where you would see it. Filtering per signal rather than per request is only possible because the three are produced separately.
B. The audit event that was stored twice
This is the answer to the second obstacle, and it is the one that can only be found by counting.
A duplicate like this is found by counting rather than by noticing. Recording audit events in two ways at once — as a log record, and as an event attached to the active span — seems harmless and looks like belt and braces.
The behaviour that makes it harmful is a storage detail. Span events do not land in the traces data stream. The exporter writes them into the logs data stream, alongside ordinary log records. So an audit event recorded both ways is stored twice, with the same span identifier, about a millisecond apart, in the same index — two documents describing one thing, with nothing in either to mark it as a duplicate of the other.
| What was counted | Where it landed | Documents |
|---|---|---|
| Audit documents in the logs data stream | logs-* | 53 |
| — of those, emitted as log records | logs-* | 28 |
| — of those, emitted as span events | logs-* | 25 |
| Span events in the traces data stream | traces-* | 0 |
So each service emits the log record only. The lesson is more general than this one mechanism: an audit trail is a claim about how many times something happened, so any mechanism that can silently double its rows is a correctness problem rather than a tidiness problem. And a duplicate like this stays invisible because both writes work. Nothing fails. The only way to see it is to count what is there and compare it against what should be.
C. Metrics, and the cost of a careless label
This is the answer to the fifth obstacle: the one that costs nothing today and a great deal by the ten-thousandth article.
Each service exports a small, fixed set of instruments rather than everything it could. Request count as a counter and request duration as a histogram, both labelled with the HTTP method, the route and the status code, exported on a periodic reader every ten seconds. That is enough to see traffic, error rate and latency distribution per route, which covers most of what I actually ask.
Two implementation details are less obvious. Delta temporality is mandatory rather than preferred, because the exporter in time-series mode rejects cumulative counters and histograms outright — a detail that belongs in a comment beside the configuration, since the symptom is a rejection at write time far from the code that chose it. And the PHP service cannot use a periodic reader at all, because the process does not outlive the request; it uses a manually collected reader flushed at the end of each request, and still chooses delta, so that the same instrument from two services means the same thing.
The failure mode I care most about is cardinality, because it degrades the store rather than the code. Labelling a request metric with the path rather than the route template means every distinct URL creates a new time series, so a site with ten thousand articles has ten thousand series for one instrument.
// Route TEMPLATE, never the raw path: `/blog/{slug}` is one time series,
// `/blog/an-actual-article-title` is one per article.
let route = matched_route.unwrap_or_else;Where routing is dynamic and no template is available, paths are collapsed to patterns by hand. That is unglamorous and it is the right tradeoff: a small amount of explicit mapping, maintained by the people who know which parts of a path are identifiers, against unbounded growth in the metrics store.
Two additions have paid for themselves repeatedly. The first is an observable gauge reporting database connection pool usage, split into idle and in-use. Pool exhaustion is a failure that presents as unexplained latency and then as errors, and without the gauge the first evidence is a user complaint; with it, the saturation is visible on a dashboard before it becomes an outage. The second is counters for business events rather than infrastructure — documents signed, certificates issued and revoked, jobs processed — each with an outcome label, so success and failure are the same series split rather than two unrelated numbers.
The pattern I like most is the smallest one: outbound client calls emit both a duration histogram and a counter from the same finally block. Because they are recorded together at the point where the call ends, every instrumented outgoing call automatically produces both, and there is no way to add a call that has timing but no count.
D. Storage, mappings, and the template that would break only metrics
This is the answer to the third obstacle: a template of my own that would replace the mappings I need.
Data lands as OTel-native data streams rather than in the older common schema, which matters more than it sounds: it determines which index templates and mappings apply, and mixing the two assumptions is how mappings get clobbered.
The trap is easy to walk into. A single-node cluster should not ask for replicas it cannot place, so the reasonable-looking fix is one catch-all template setting the replica count to zero for everything. That template silently replaces the official mappings that ship for these data streams, and the failure is narrow and delayed: logs continue, traces continue, and metrics start being rejected with a parsing error complaining that a dynamic template it needs does not exist. Metrics depend on those dynamic templates to type their numeric fields, and logs and traces mostly do not.
The answer is composition rather than override. One tiny component template holds the single setting I actually want to change, and one index template per signal composes the stock components plus that one, with mine listed last so it wins on the setting without replacing anything else. The ordering is the whole mechanism: last writer wins per field, so a minimal component placed at the end changes exactly one thing.
{ }One more thing that is easy to miss: fixing a template does not fix the indices already created from the broken one. Backing indices keep the mapping they were born with, so a rollover is required to force the data stream onto a new index built from the corrected template. Until you do, the fix is real and the errors continue, which is a confusing five minutes.
The credentials the collector uses are scoped to what a writer needs: index privileges limited to the specific data-stream patterns it writes, no access to security indices, no business data, no delete. The principle I would state without qualification is that the component with the widest network exposure should hold the narrowest credential, because a telemetry pipeline receives data from everything and is therefore the most attractive thing in the stack to compromise.
E. Reading it: data views, a runtime field, and dashboards as artefacts
Three data views, one per signal, created with stable identifiers rather than generated ones. That detail is administrative and it is the difference between dashboards that can be exported and re-imported anywhere and dashboards that break on a fresh cluster, because saved objects reference data views by identifier.
The most useful small thing in the whole visualisation layer is a runtime field. Span duration arrives in nanoseconds, which is correct and unreadable — an axis labelled in hundreds of millions communicates nothing. A computed field divides it into milliseconds at query time, with a guard for missing values.
I like this because of where the transformation lives. It could have been done in the exporter, which would have meant rewriting data on the way in and being stuck with the choice; or at ingest, which would have meant reindexing to change it. As a runtime field it costs nothing until queried, applies retroactively to data already stored, and can be changed by editing one definition.
The dashboards themselves are checked into the repository as exported objects and imported through the saved-objects API with the overwrite flag set, which is the flag that makes re-running the import idempotent rather than an error. The maintenance loop is deliberately one-directional: edit in the interface where editing is pleasant, export with related objects included, overwrite the file in the repository, and re-import elsewhere to replicate. The interface is the editor; the file is the source of truth.
Four dashboards, each answering one question: forensics and audit, errors and reliability, performance and traffic, and service health. The errors dashboard is the only one that spans two data views, logs and traces together, and it is the one I open first — because an error is exactly the case where you need both what the code said and where in the transaction it said it.
Finally, the exposure of the read plane, which is a one-line property rather than a subsystem. Because a port mapping accepts an address on the left-hand side, binding the administrative interface to a private network interface is a change to one variable.
ports:
  - "${KIBANA_PORT}:5601"   # e.g. 10.x.x.x:5601 — VPN interface only
No reverse proxy, no firewall rule, no public listener to protect. The tighter version of the same idea is to publish no host port at all for the store itself, leaving it reachable only over the container network by name, so the only thing with a host binding is the interface a human needs.
Conclusion
If I keep one sentence from this, it is that observability is a data modelling problem wearing an operations costume. The hard part was never shipping bytes to a central place; that is a collector and an afternoon. The hard part was deciding what structure the data should have, and the answer to that is the same one that applies to any data model: put the structure where the meaning is, which is in the application, and keep every layer downstream of it dumb.
The three signals have held up as a division of labour because they genuinely answer different questions, and the discipline is to keep them from drifting into being three copies of the same thing. Traces are for structure and causality. Logs are for reasoning, which means a log line that restates what the span already says is noise, and a log line explaining why a branch was taken is worth ten. Metrics are for aggregate behaviour, which means their enemy is unbounded labels and their value is being answerable instantly over long windows. Correlate them all on one identifier and you can enter from whichever end you have — a user complaint, an alert, an anomaly on a chart — and reach the same transaction.
The failures generalise better than the design. Telemetry that is dropped when the destination is unavailable is not a monitoring system, it is a monitoring system that is blind precisely during the incidents it exists for, and the fix is a queue that survives the process rather than a longer timeout. A dependency that starts in the same second as the thing depending on it has not been ordered, because readiness and liveness are not the same claim. And a change intended to make telemetry more reliable can take telemetry down entirely, which is the argument for validating configuration out-of-band before touching anything running.
None of this depends on my stack. OpenTelemetry, that collector and that store are what I happen to run; the method is what survives replacing all three. Ask of your system: is there one place telemetry goes, or many? Is meaning attached at the source, or inferred downstream by something that will disagree with the source eventually? Does one identifier connect a user's complaint to a specific operation in a specific service? Can the store be down for ten minutes without losing the record of what happened during those ten minutes? Those questions have the same answers whichever tools you pick, and the answers matter more than the tools.
And whatever you build, hold it to the rule that decided every initialisation path in this system: telemetry must not become a failure point. The moment the thing watching the system can stop the system, you have added risk in exchange for visibility — which is the trade you thought you were avoiding.
Terms
- OpenTelemetry
- An open standard, with libraries for most programming languages, describing how a program records logs, traces and metrics and exports them to a collector.
- OTLP
- The OpenTelemetry Protocol: the wire format services use to send logs, traces and metrics to a collector, available over HTTP or gRPC.
- Span
- One timed operation within a trace, carrying a start, a duration, attributes, and a reference to its parent — the unit from which a trace's tree structure is built.
- Trace context
- The identifiers that say which trace an operation belongs to and which span is its parent, carried between services in a standard header so a transaction stays one transaction.
- Propagator
- The component that writes trace context into an outgoing carrier and reads it from an incoming one. Using it rather than formatting the header by hand is what keeps trace structure correct.
- Cardinality
- The number of distinct label combinations on a metric, and therefore the number of time series it creates. Labelling with unbounded values such as raw paths makes it grow without limit.
- Delta temporality
- Reporting the change in a metric since the last export rather than a running total. Required by some storage backends, and a property that must be consistent across services for their instruments to be comparable.
- Data stream
- An append-only abstraction over a series of backing indices. Because each backing index keeps the mapping it was created with, a template fix only reaches new data after a rollover.
- Runtime field
- A field computed at query time from stored data rather than written at ingest, which makes it changeable retroactively and free until it is queried.
Technologies covered
- PHP
- Python
- Rust
- Elasticsearch
- Docker
- Kibana
- OpenTelemetry